
So, what is a stroke? And no! We're not talking about golf, or rowing, or painting.
We're talking about A STROKE. You know, the medical condition caused by poor blood flow to the brain.
Every 40 seconds someone in the United States suffers from a stroke. According to the World Health Organization (WHO) stroke is the 2nd leading cause of death globally, responsible for approximately 11% of total deaths.
Now, there are two main types of stroke: Ischemic, due to lack of blood flow, and Hemorrhagic, due to bleeding. BOTH can cause parts of the brain to stop functioning properly (think along the lines of an even deadlier drunken experience, because you can't control it and there's no alcohol involved). While there are numerous studies that have tried (and are still trying!) to figure out what triggers strokes among various individuals, there are actually a few modifiable and non-modifiable risk factors that can increase your chances.
So...
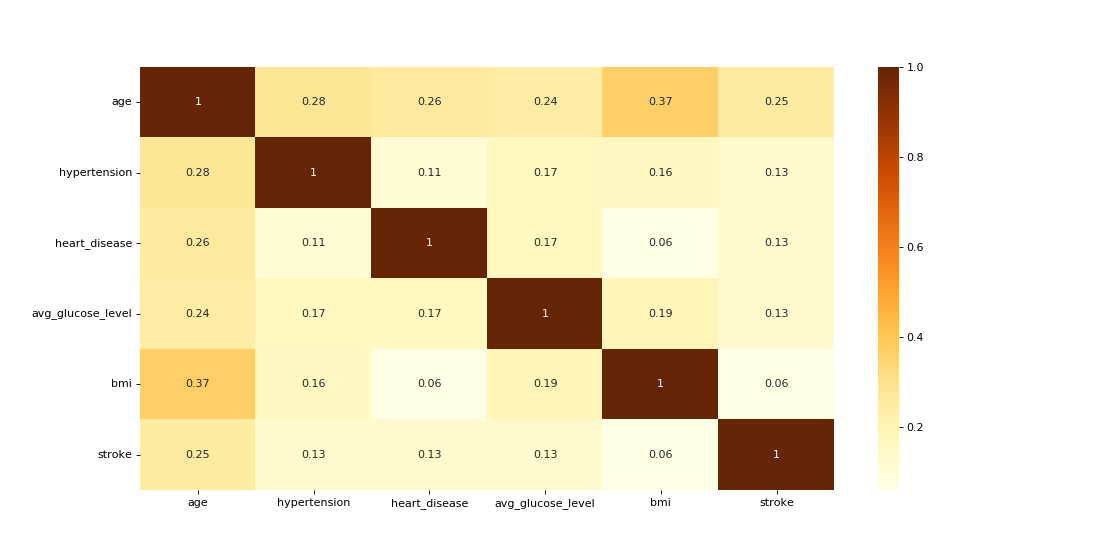
Our model shows that the older you are, the more likely you are to have a stroke (We really feel like that was a huge "DUH!" moment for us), and those chances double around every 10 years after age 55. So, although strokes are common among older adults, many people younger than 65 years are also prone to strokes. CDC.gov
Your Average Glucose Level (AGL) plays a huge role in assessing the risk of a stroke. This is why diabetics are considered to be high risk stroke patients. If left untreated, or improperly regulated, diabetes can cause sugars to build up in the blood and prevent oxygen and nutrients from getting to the various parts of your body, including your brain. CDC.gov
Although we agree that a person's Body Mass Index (BMI) should never be used to shame anyone (ESPECIALLY since the science behind it ignores the fact that muscle weighs more than fat and that that muscle/fat distribution can skew anyone into the overweight/obese range), our model did show a strong relationship between a person's BMI and stroke probability. So, while a high BMI doesn't necessarily equate to obesity, a higher BMI can be linked to increased stroke risk. CDC.gov
~If A Tree Falls In A Forest And No One Is Around To Hear It, Will It Still Tell You The Risk?~
Since we wanted our model to classify whether someone was at risk for a stroke or not (creating that 0 or 1 binary used in classification), we used the Random Forest Classifier model (* NOT to be mistaken for the Random Forest Regressor model, which uses the means to determine the output of the regression)
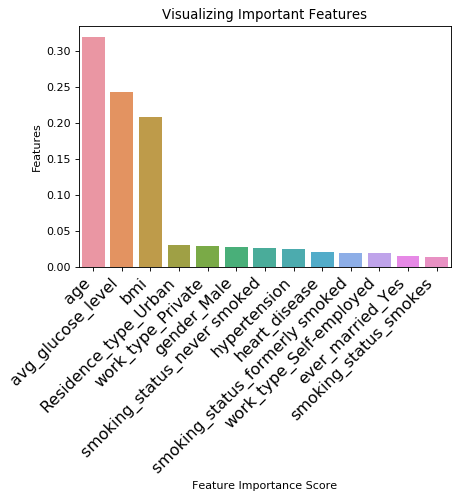
The .feature_importances_ (which is used to score the usefulness of the input variables at predicting the target variable... so in this, the stroke itself) provided the Top 3 variables that were critical to the predictability of our model. The Top 3 Are As Follows:
1) Age: ~32% (0.319062)
2) Average Glucose Level: ~24% (0.242591)
3) BMI: ~21% (0.208355)
THAT'S 77% OF THE MODEL!!!
The other 10 variables make up the other 23%, which averages out to about 2.3% per variable. Since that is such a HUGE DIFFERENCE compared to the third highest variable (almost 10x the difference), we decided to eliminate any questions pertaining to those from our quiz.
~Age Ain't Nuthin' But A Number!... Isn't It?~
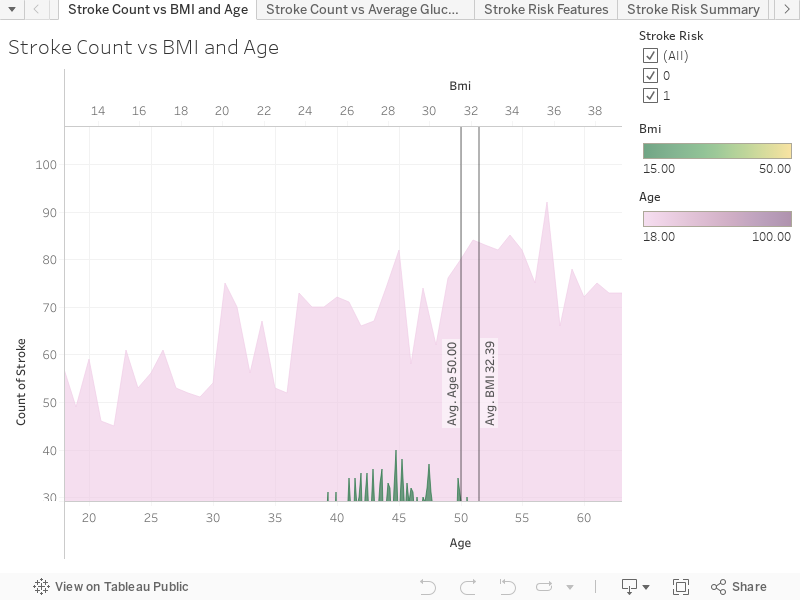
Two of our top stroke risk factors are: 1) age, and 2) BMI. The data shows the average BMI and age being 32.39 and 50 respectively. As you get older and/or your BMI increases, your actual risk for having a stroke increases as well. Your BMI is one of those modifiable risk factors previously mentioned. It means that with changes to your diet and exercise routines (and maybe some medical intervention if needed), you can decrease your BMI. With that BMI decrease, you can not only decrease your risk of a stroke, but also for diabetes, joint pains, and other health issues. If you want to read more: National Library of Medicine
**There are many BMI calculators online, but please take those results with a grain of salt or 2.**
Here are the ranges that are used to describe the riskier BMI levels:
~Uncloak The Stroke!~
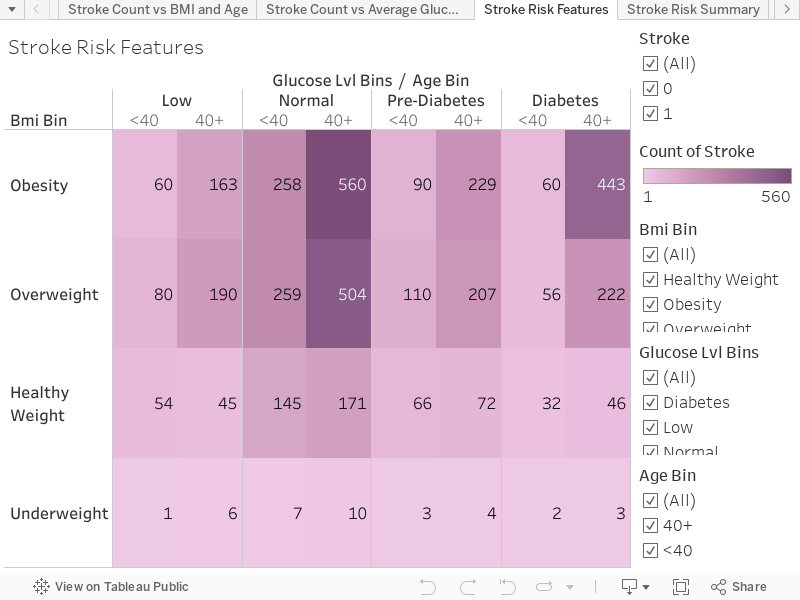
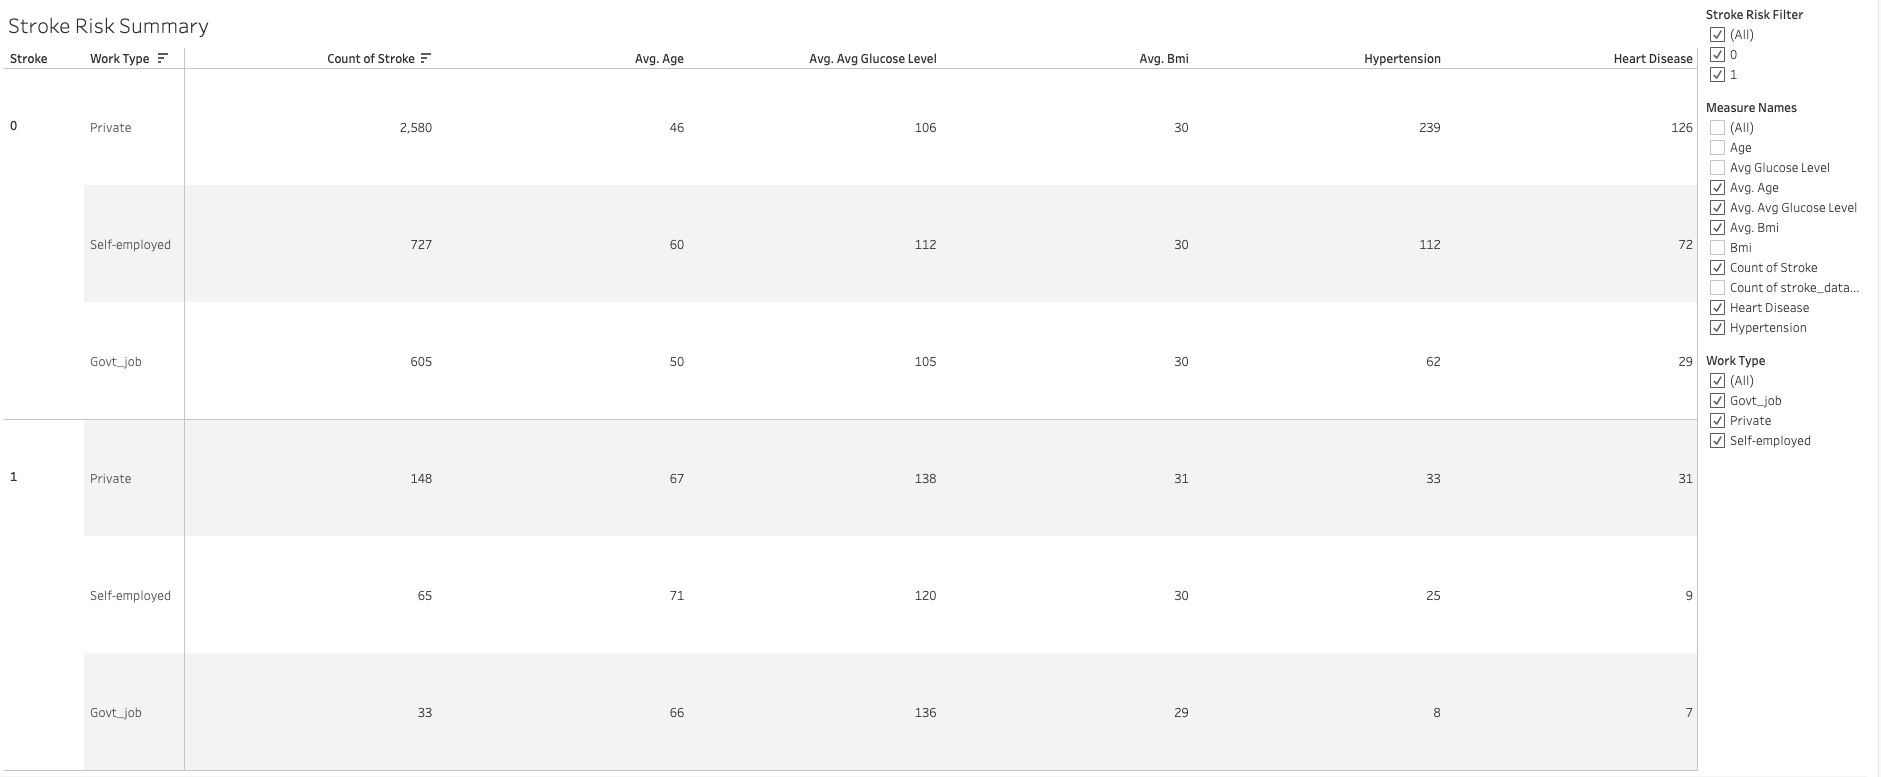
This interactive chart shows the number of adult patients from the study that had a stroke (560 out of the 4158), and then grouped them accordingly based on their ages, glucose levels, and BMIs. Try modifying the risk factors on the chart to see how the count of strokes increases or decreases.
Age:
Average Glucose Levels:
BMI
**BMIs Binned According To CDC.gov.
Interactive Chart

We extracted the raw data from kaggle (Link: Brain Stroke Prediction Dataset. The dataset was uploaded and transformed in jupyter notebook. We then loaded the clean dataset to Tableau.

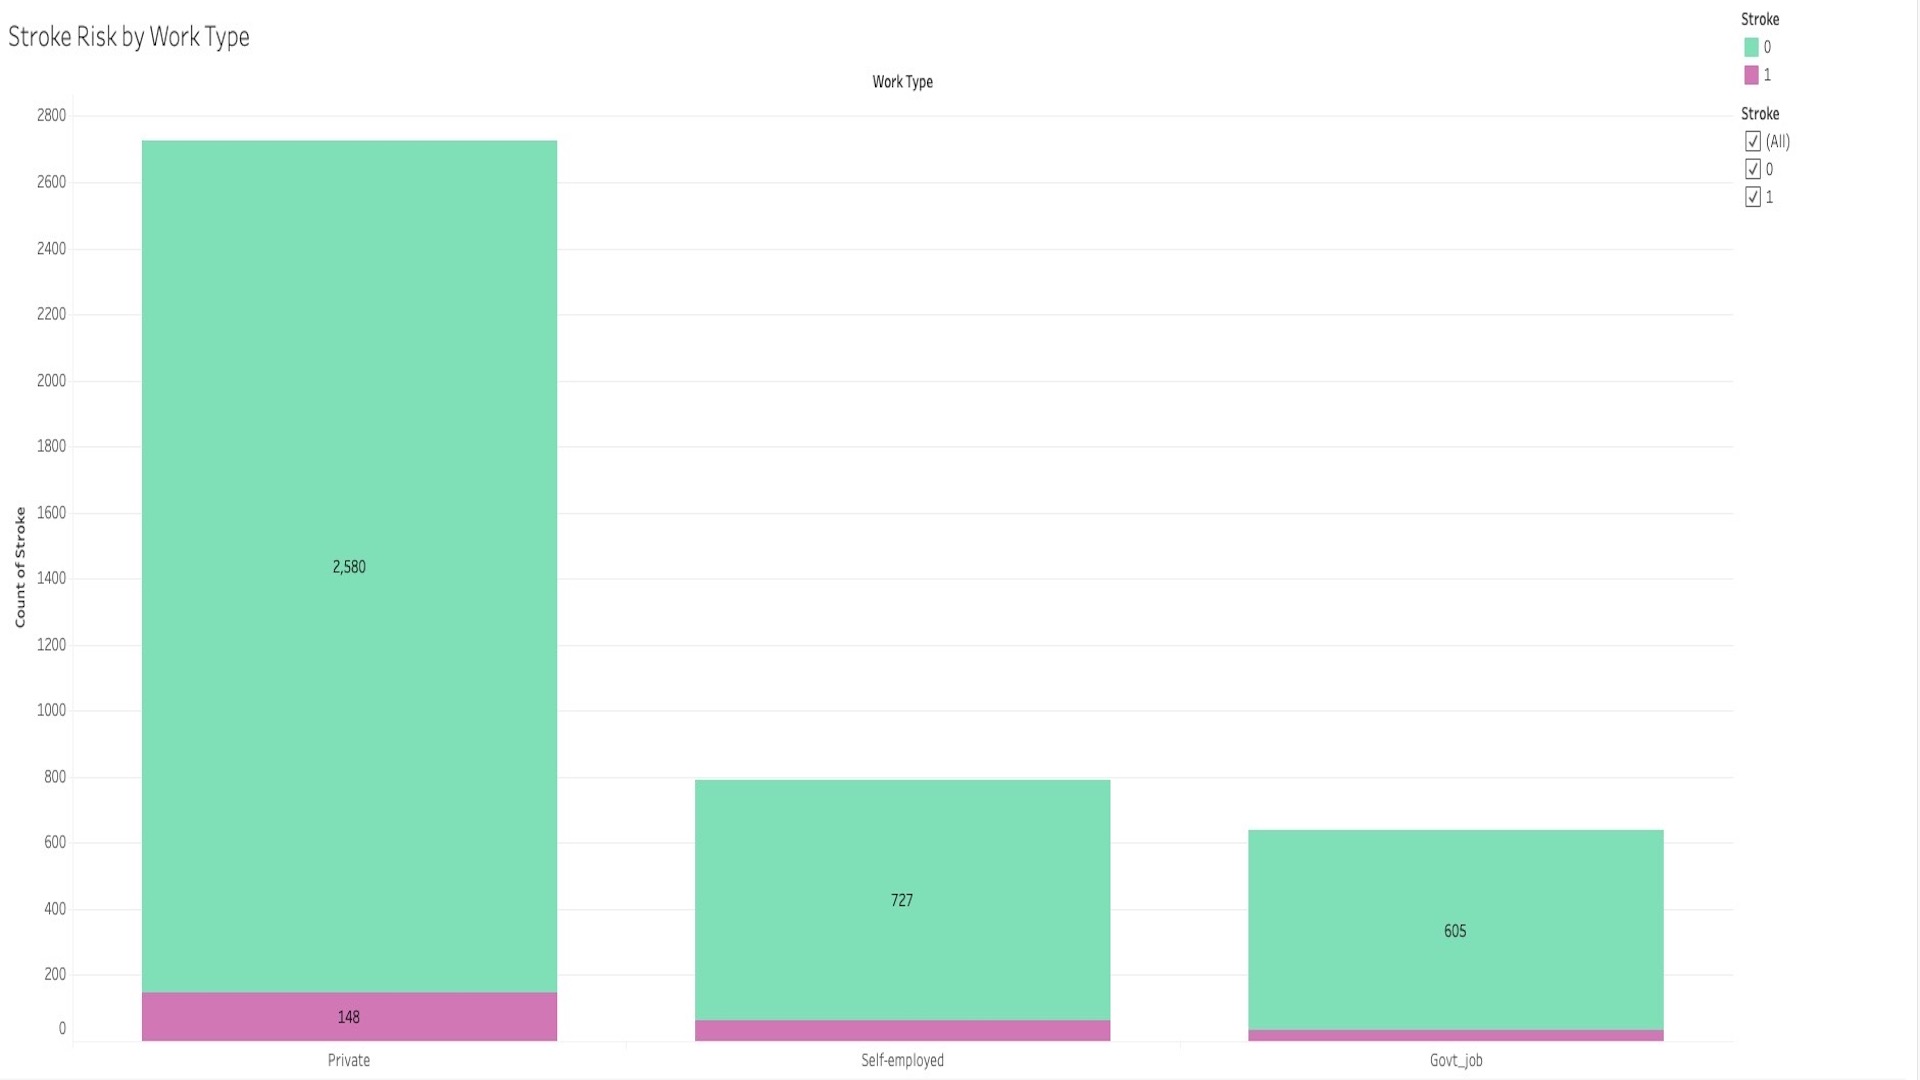
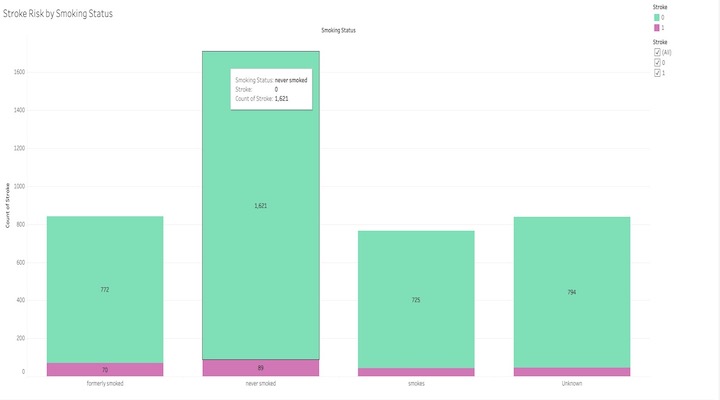
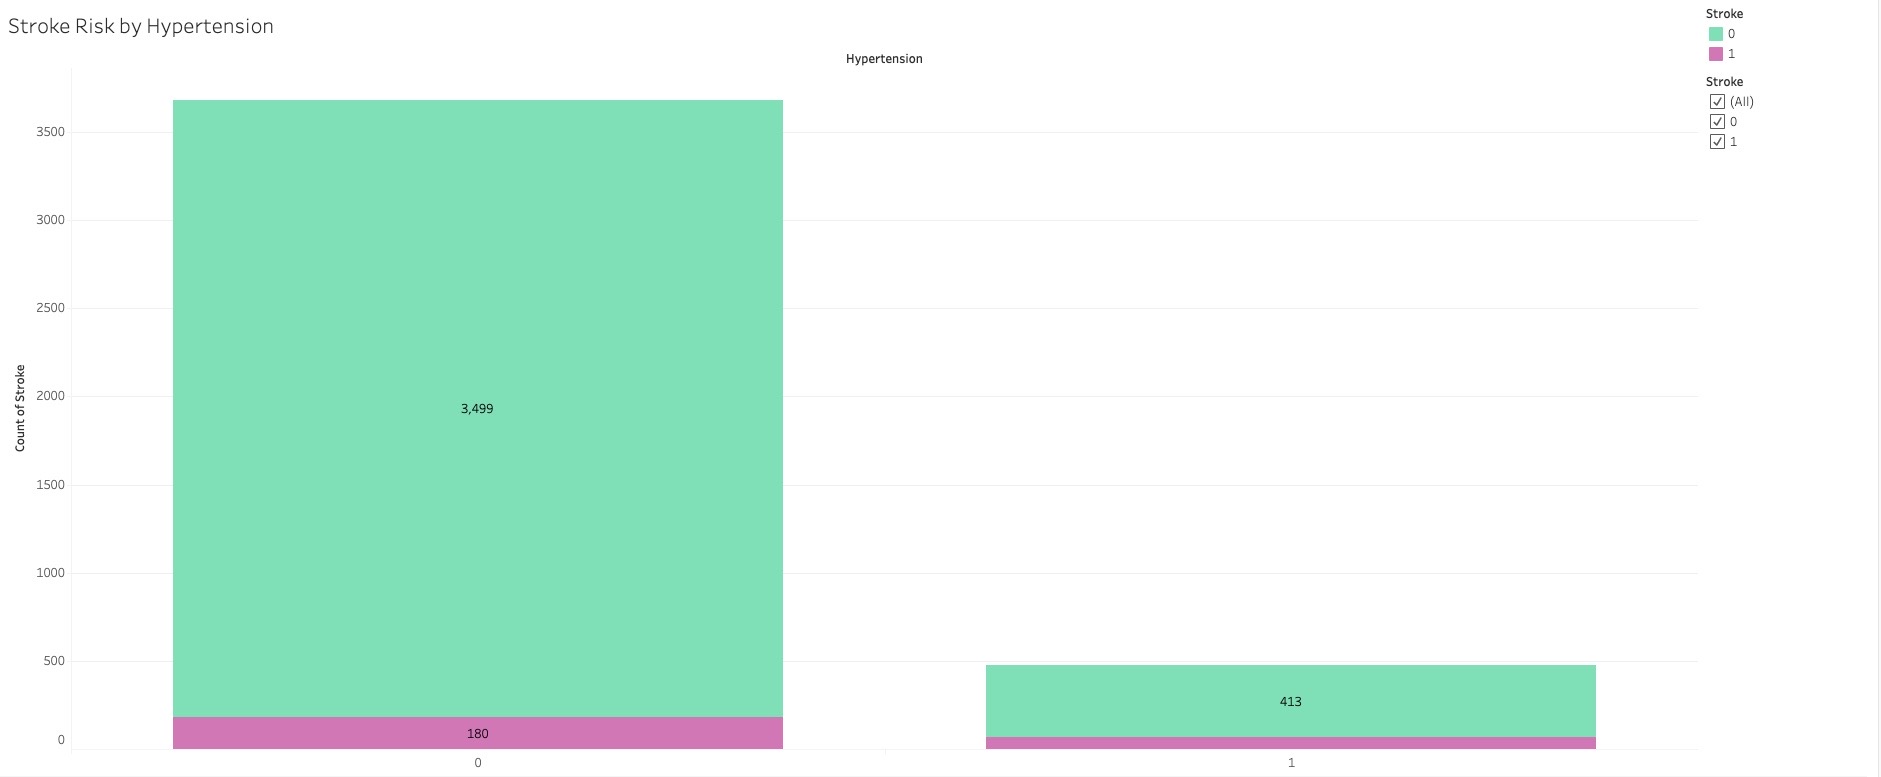
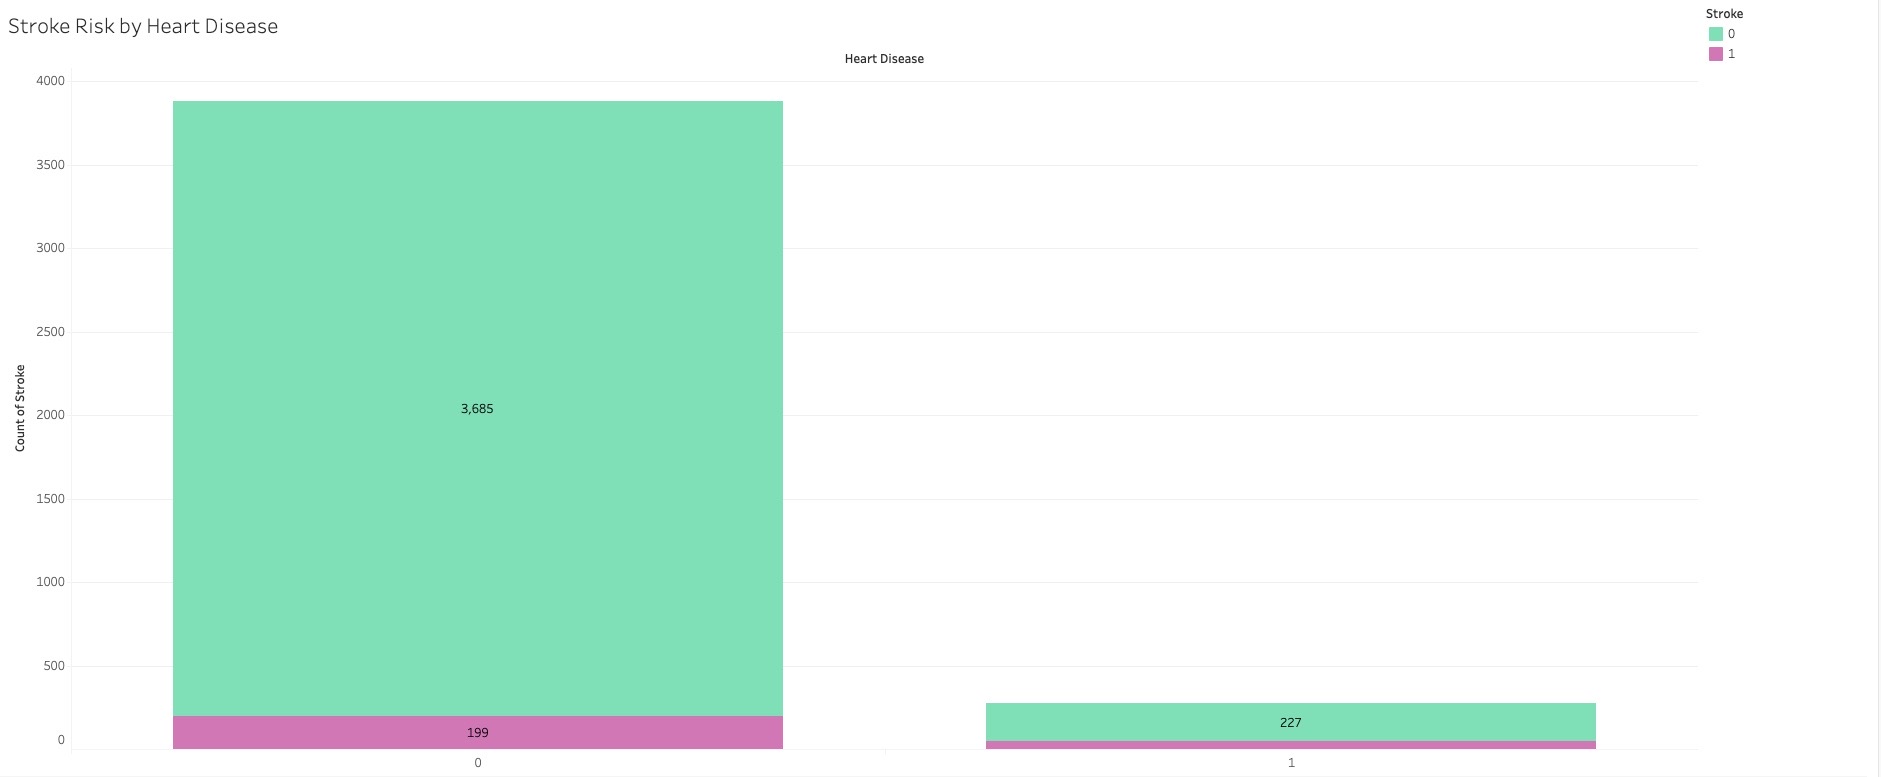
The dataset was used to predict if a patient is likely to have a stroke based on the input variables like gender, age, bmi, and smoking status using Random Forest Classifier.

Using the cleaned dataset, we uploaded it to Tableau to create our visuals. We used several interactive charts to show and animate how each variable affects the model's prediction of a stroke.

HTML was used to capture our data visualizations. An internal CSS was used to define a style for the HTML page.

JavaScript was used to create the Stroke Risk Quiz, as well as make the HTML page more dynamic and interactive.

We used github pages to deploy "fUZZbEED". Our team hopes you enjoyed learning about our stroke risk prediction model.
